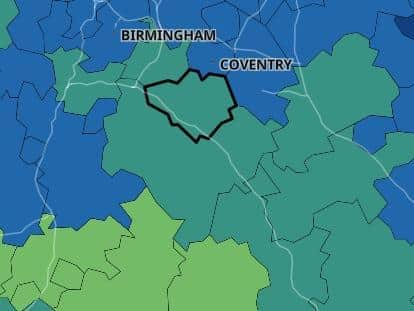
Rate of Covid-19 cases continues to fall across Leamington, Kenilworth and Warwick - here are the figures compared to the start of lockdown
and live on Freeview channel 276
The rate of Covid-19 cases has continued to fall across across Leamington, Kenilworth and Warwick
The latest Government figures cover the seven-day period up to February 26 and show a steady decline in positive cases.
Advertisement
Hide AdAdvertisement
Hide AdThese numbers show the Warwick district now has a rate of 82.1 cases per 100,000 people, slightly above the national average.


This time last month it had a rate of 157 - and two months ago when lockdown had just started, it had a rate of 383.3.
While the decline in cases over the past two weeks has slowed, it is still heading in the right direction - for both the Warwick district and Warwickshire.
Over the past 24 hours, Public Health England figures show there were 82 new cases across the county.
Advertisement
Hide AdAdvertisement
Hide Ad